filmov
tv
Doing a Perf Audit of your Polymer App (The Polymer Summit 2015)

Показать описание
Performance is measured from the ground truth of the browser internals, and you're operating a few levels up, with the DOM, framework code, and JavaScript sitting between your users finger and the resulting screen paints. In this session Paul Irish will show how the Chrome DevTools can help you understand where time is spent in your app and effective means of profiling your performance. You'll walk away with a solid understanding of how your polymer work can be as fast-loading and responsive-to-the-touch as you like.
 0:35:16
Doing a Perf Audit of your Polymer App (The Polymer Summit 2015)
 0:01:42
What is performance auditing?
 0:06:42
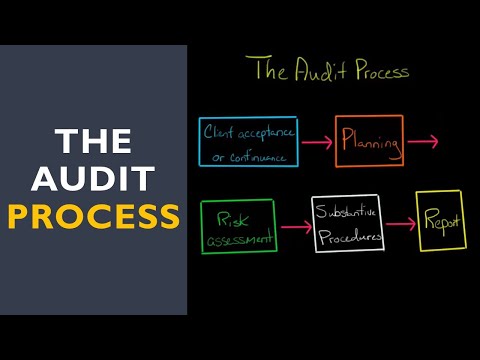
The Audit Process
 0:12:59
The Anatomy of a Performance Audit with Sam Bhagwat
 0:00:31
What Does a Performance Auditor Do?
 0:04:07
IATF 16949 audits | How do I: Audit Production Management Performance
 0:46:57
Recorded Webinar: Performance Audit - A Tool for Both Private & Public Sectors
 0:09:25
Amazon PPC Audit Like a Pro - Find Your Keyword Market Share, Match Type Utilisation and More
 0:53:33
Innovating Performance Management: PwC’s Unique Approach to Employee Success with Kimberly Jones
 0:13:31
Basic SEO Audit for Beginners | How to Do a FREE SEO Audit in Under 15 Minutes
 0:02:08
Performance auditing at the Office of the Auditor-General
 0:13:36
Audit Materiality and Performance Materiality: How to Use Them
 0:06:40
OBJECTIVES OF PERFORMANCE AUDITS
 0:02:49
Marketing Audit Explained
 0:20:01
ACCA (AAA) The Audit of Performance Information in the Public Sector
 0:57:55
Audits and Quality improvement Projects: the basics
 0:26:39
Comprehensive SEO Audit Guide: Perfect for Beginners!
 0:02:08
What skills does a performance auditor need to have?
 0:04:31
What is the difference between a Performance Review and an Audit?
 0:13:32
WHAT IS AUDIT MATERIALITY? - Overall Materiality vs Performance Materiality
 0:04:06
Materiality Vs Performance Materiality | SA 320 | CA INTER AUDIT | CA Rohan Gupta
 0:05:29
Performance Auditing, Totally Tooling Tips (S1, Ep5)
 0:22:05
Materiality of planning and performing an audit
 0:08:58
IATF 16949 auditor guide | Auditing continual improvement
Комментарии