filmov
tv
Graphs of Sine, Cosine and Tangent Functions
Показать описание
This lesson shows examples of graphing transformed y = sinx and y = cosx graphs (including changes in period, amplitude, and both vertical & horizontal translations). There is also an example of how to graph y = tanx using the y = sinx and y = cosx functions. This lesson was created for the MHF4U Advanced Functions course in the province of Ontario, Canada.
 0:22:37
How To Graph Trigonometric Functions | Trigonometry
 0:11:40
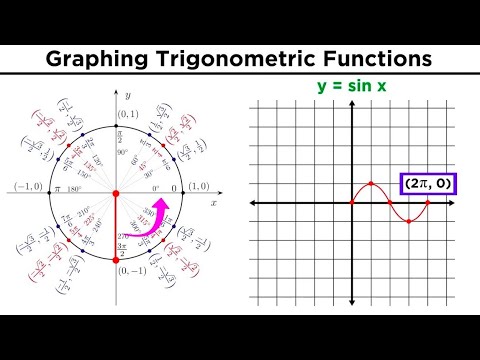
Graphing Trigonometric Functions
 0:12:00
Graphing Sin and Cos
 0:14:07
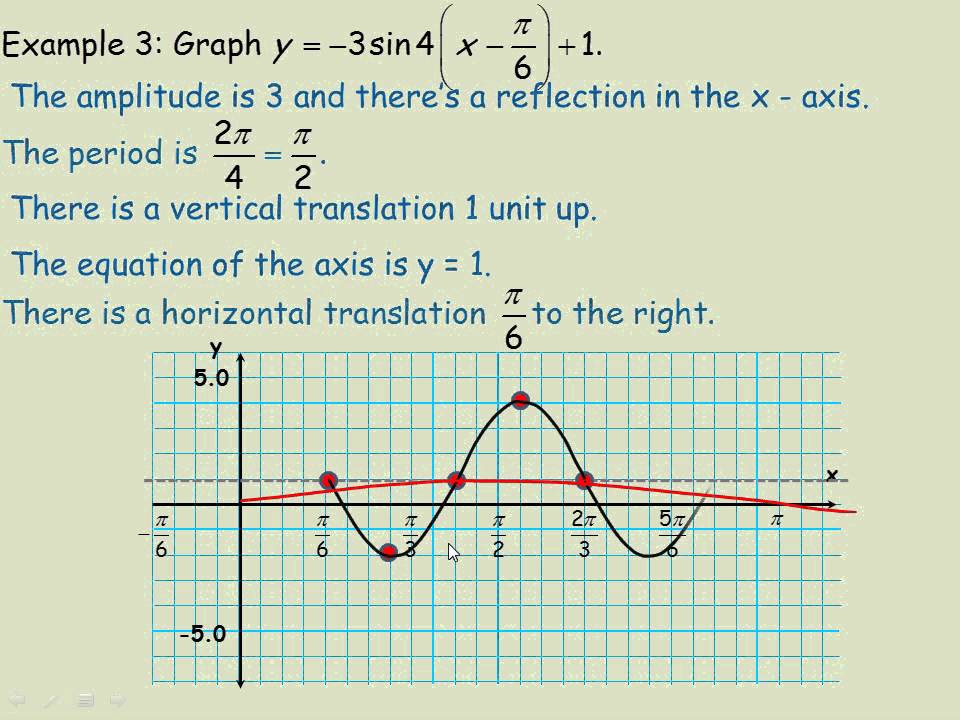
Graphing Sine and Cosine Functions with Transformations (Multiple Examples)
 0:00:27
Sine Curve and the Unit Circle
 0:01:12
Visualizing Trigonometry: Sine Function
 0:03:52
Graphs - Sin Cos and Tan Graphs
 0:34:34
The Graphs of Sine and Cosine (Precalculus - Trigonometry 11)
 1:34:10
Week 11 - Inverse & Hyperbolic Functions: Derivatives, Integrals, and Beyond -Math for Electroni...
 0:30:12
Sine, Cosine and Tangent graphs explained + how to sketch | Math Hacks
 0:07:24
Graphing Trigonometry Function (y=sinx)
 0:06:32
Graphs of Sine, Cosine and Tangent (Edexcel IAL P1 6.5)
 0:10:38
Graphing Trigonometric Functions (Example: y = 3cos(x) - 2)
 0:43:05
Graphing the Sine & Cosine Functions - [2-21-8]
 0:08:28
Edexcel AS Level Maths: 9.5 Graphs of Sine, Cosine and Tangent
 0:22:56
4 10 Graphs of Sine, Cosine and Tangent Functions Part 1
 0:17:03
Graphing Sine and Cosine Using a Table and Transformations
 0:35:01
GRAPHS OF SINE AND COSINE FUNCTIONS || PRE-CALCULUS
 0:01:01
How to Graph a Sine Graph in the form y=Asinbx
 0:04:14
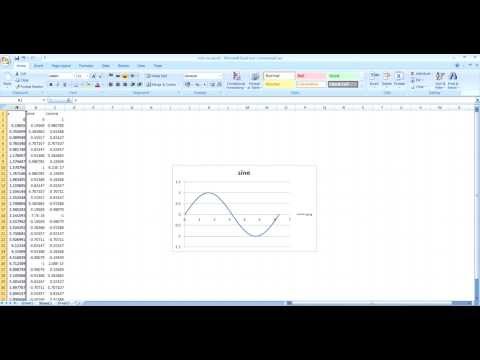
How To Draw Sine and Cosine Graphs in Excel Tutorial
 0:00:54
Sine & cosine function. How to draw sine & cosine graph.
 0:06:20
Sine or Cosine Writing Equations Given Graph
 0:00:16
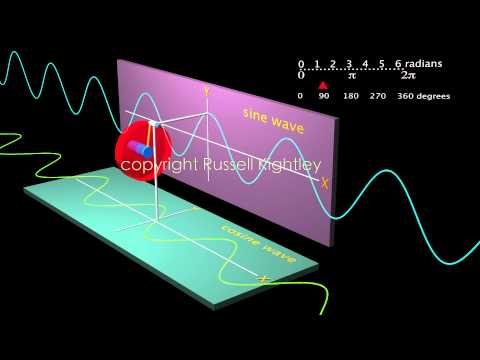
sine cosine wave animation by Russell Kightley
 0:03:43
Graphing a Sine Function by Finding the Amplitude and Period
Комментарии