filmov
tv
Question 2 Exercise 12.1 Chapter 12 Class 9 | Statistics | NCERT Maths
Показать описание
In this tutorial, you will find the explanation and solution of the following question from CBSE board Class 9 NCERT Maths text book:
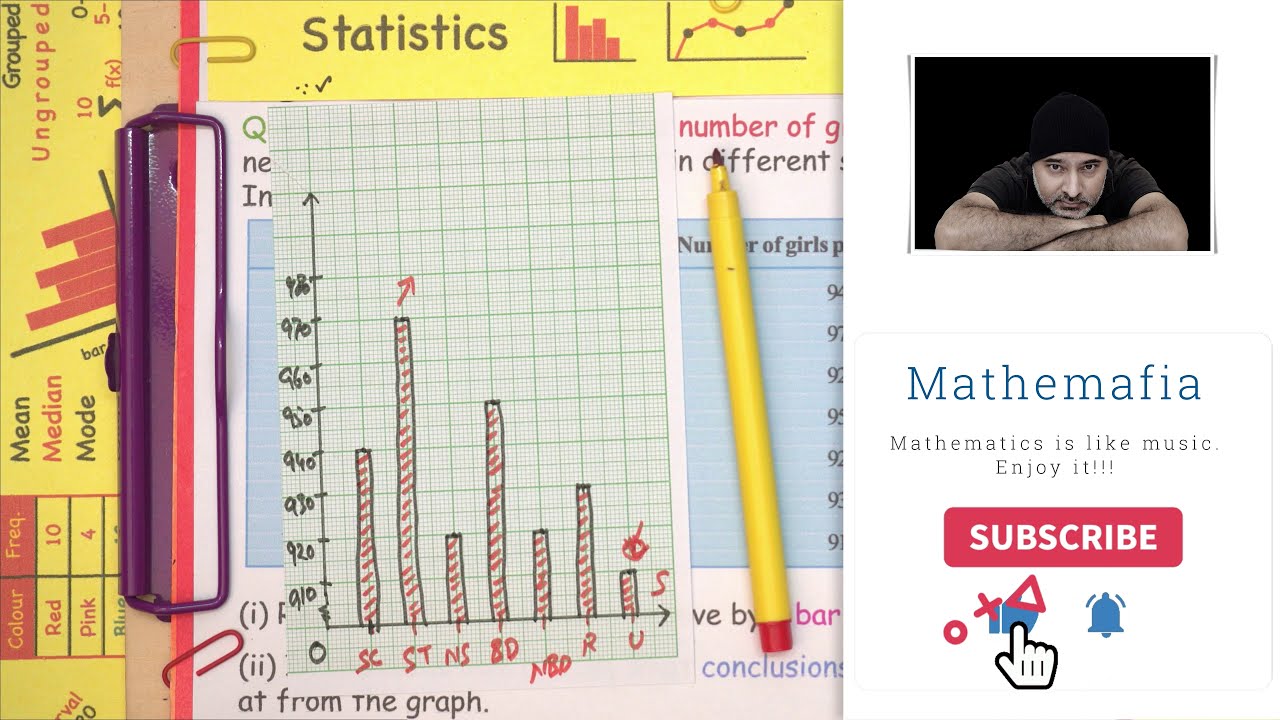
The following data on the number of girls (to the nearest ten) per thousand boys in different sections of Indian society is given below.
(i) Represent the information above by a bar graph.
(ii) In the classroom discuss what conclusions can be arrived at from the graph.
In this tutorial, you will find the explanation of the following:
Class: 9th
Chapter: 12, Statistics
Exercise: 12.1
Topic: Question 2
Textbook: NCERT
#Statistics #Chapter12Class9Maths #StatisticsQuestions #Chapter12OfClass9Maths #statsclass9maths #class9mathschapter12 #mathsclass9 #class9maths #mathsbysunilsir #mathsbysunilsyal #mathsbymathemafia #class9mathsbymathemafia
 1:14:02
EX 12.1 Q1 TO Q10 SOLUTIONS OF LINEAR PROGRAMING NCERT CHAPTER 12 CLASS 12th
 0:22:13
2nd Year Math Ch 1 - Class 12 Maths Chapter 1 exercise 1.2 Question 1 - 12th Class Math Chapter 1
 0:08:23
Class 9 Maths | Chapter 12 | Exercise 12.1 Q2 | Heron's Formula | NCERT
 0:25:52
EX 2.1 Q1 TO Q14 SOLUTIONS OF INVERSE TRIGONOMETRIC FUNCTIONS NCERT CHAPTER 2 CLASS 12th
 0:03:16
Class 12 Ex 3.1 Q2 Math | Chapter 3 Matrices | Q2 Ex 3.1 Class 12 Math | Ex 3.1 Q2 Class 12 Math
 0:03:12
Class 12 Ex 5.1 Q2 Math | Continuity | Chapter 5 | Q2 Ex 5.1 Class 12 Math | Ex 5.1 Q2 Class 12 Math
 0:38:55
Class 12 Maths Chapter 12 in Hindi Linear programming, Part 02 exercise 12.1Question 1 to 5
 0:03:23
class 10 maths chapter 12 exercise 12.1 question 1 in hindi
 0:03:50
class 10 maths chapter 12 exercise 12.2 question 1 in hindi
 0:06:48
Class 9 Maths | Chapter 12 | Exercise 12.1 Q1 | Heron's Formula | NCERT
 0:11:09
Ex-12.2 Q-1,2 | Chapter 12 | NCERT | Class 10th Math
 0:41:10
Class 7 Maths Chapter 12 | Algebraic Expressions - Ex 12.1 Solutions | NCERT Maths Class 7
 0:00:28
The Hardest Math Test
 0:00:27
How to Answer Any Question on a Test
 0:26:53
Ex-2.1 Q-1 to 14 | Chapter 2 | Inverse Trigonometry | Class 12th NCERT Math |
 3:39:28
class 12th chemistry chapter 1 2022 | thos avastha full chapter | solid state one shot in hindi
 0:51:06
Class 12th Physics Chapter 1 NCERT Solution 1.1 to 1.14
 0:17:04
Relation and Function Class 12 Maths chapter 1 Complete Revision in 15 Mins !!!
 0:32:46
12th Maths-1 | Chapter No 1 | Mathematical Logic | Lecture 2 | Maharashtra Board |
 0:17:18
Q 2 - Ex 12.2 - Factorization - NCERT Maths Class 8th - Chapter 12, New Syllabus 2023 CBSE
 0:38:58
EX 3.1 Q1 TO Q10 SOLUTIONS OF MATRICES NCERT CHAPTER 3 CLASS 12th
 0:22:07
Formulas & Ex-2.2 Q-1 to 4 | Chapter 2 | Inverse Trigonometry | Class 12th NCERT Math |
 0:11:51
Class 9 Maths | Chapter 12 | Exercise 12.2 Q1 | Heron's Formula | NCERT
 1:02:05
Solid State Class 12 Chemistry - L1 | Chapter 1 | Classifiation of Solids | Harsh Sir |Vedantu Combo
Комментарии