filmov
tv
Paired samples t-Test in SPSS - checking normality assumption

Показать описание
// Paired t-Test in SPSS - checking normality assumption //
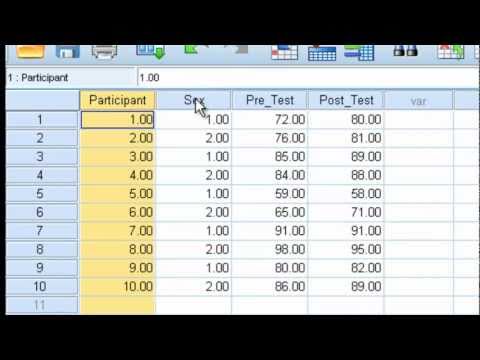
The main requirement of the paired sample t-test, next to the interval or ratio level for the test variable, is normal distribution. However, not the test variable itself has to be approximately normally distributed. Rather, the residuals need to be. The residuals are simply the difference of the measurements for each individual.
Despite there being three ways to test for normal distribution, the Shapiro-Wilk-test, a histogram or a Q-Q-plot, I will only show the latter for the following reason:
As with all analytical tests, large samples have more power and will “find” significant deviations from normal distribution, even if those deviations are negligible. Therefore, caution is advised when blindly trusting a p-value.
Please refer, among many other publications, to Lantz, B. (2013). The large sample size fallacy. Scandinavian journal of caring sciences, 27(2), 487-492.
Eventually, put emphasis on the plots, mainly a histogram or a q-q-plot. I prefer the latter since one can manipulate the histogram with a proper "bin width".
Final note: a z-standardization before plotting a histogram or q-q-plot is optional. You will only see a slightly different histogram (reminder of the bin width) with less cliffs on the inside. The q-q-plot is not affected, hence my advise to use this as a test for normal distribution.
⏰ Timestamps:
==============
0:00 Introduction and overview
0:13 Calculating residuals
0:38 Possible ways to test for normal distribution
1:01 Q-Q-Plot for the residuals
If you have any questions or suggestions regarding the normal distribution testing for the paired samples t-test in SPSS, please use the comment function. Thumbs up or down to decide if you found the video helpful.
#statorials
Support channel? 🙌🏼
===================
Thank you for your support! ♥
 0:07:50
06 Paired Samples t-Tests in SPSS – SPSS for Beginners
 0:08:17
Paired-Samples T Test with Assumption Tesing using SPSS
 0:03:35
How to Run a Paired Samples T Test in Spss
 0:04:28
Paired Sample t-test
 0:05:32
Paired Sample t-test with SPSS
 0:12:33
Paired Sample T Test in SPSS and Interpretations
 0:03:24
Spss Eşleştirilmiş Örneklemler t Testi Paired Samples t Test
 0:04:18
Interpret SPSS output for a paired t-test
 0:15:30
Paired Samples t-test on SPSS (Version 29) + Example Results Section
 0:02:25
Paired Sample T-Test in SPSS
 0:03:43
SPSS - Dependent Samples t-Test
 0:09:46
Paired Samples T Test - Running, Interpreting, and Reporting Paired-Sample T-Test Results using SPSS
 0:12:43
Cara Uji Paired Sample T Test dengan SPSS Full
 0:03:13
SPSS #12 - Paired Samples T Test
 0:03:50
Paired T-TEST Using SPSS and Interpretation
 0:06:01
Paired Samples T Test Using SPSS
 0:07:55
SPSS - Paired-samples t-test (2 of 2) - creating a bar graph
 0:02:37
SPSS - Cohen's d for paired samples t-test
 0:07:19
How to Run Paired Samples t-Test in SPSS Tutorial || Paired t-test SPSS
 0:06:15
Spss ile t testi (bağımlı örneklem) ve hipotez analizleri (paired sample t test)
 0:10:03
Paired-Samples T Test Compared to Repeated Measures ANOVA in SPSS
 0:02:46
SPSS: Paired Samples T Test
 0:07:10
Paired Samples T-Test (How to calculate and interpret)
 0:25:57
Pretest and Posttest Analysis Using SPSS
Комментарии