filmov
tv
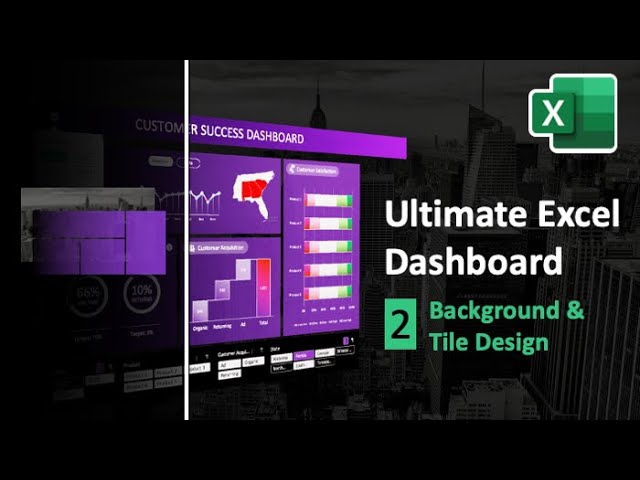
How to Create Beautiful Dashboard Background and Tile Design | Ultimate Excel Dashboard Ep. 2
Показать описание
▬▬▬▬▬▬▬▬▬▬
I just launched my new Excel Resource Website and kindly invite you to check it out.
I put a lot of work and research into it to provide you with the biggest possible value!
And even better, I integrated the most up-to-date databases about all relevant functions, formulas, and shortcuts. You can use our advanced filtering system to filter by Relevance, Category and even minimum required Microsoft Office Version. That means you can learn about all new functions in Microsoft Office 365 with only one click!
If you like that website and want to help me grow, please consider to share it online and with everyone you know.
Thanks for your support!
▬▬▬▬▬▬▬▬▬▬
How to Create Beautiful Dashboard Background and Tile Design | Ultimate Excel Dashboard Ep. 2
In this Excel Tutorial you will learn how to create a beautiful background and gradient tile design for an Excel Dashboard from scratch. You will learn how to make use of PowerPoint for quick and effective design preparations and how to integrate your designs in an Excel dashboard file with only a few clicks.
The previous Episode already covered how to build the basic interactive Excel dashboard. And the following Episodes will go deeper into the topics of modern slicer design, automation and the integration of truly advanced features like fully functional info buttons, in-tale tab functionality and a collapsable settings area with state-of-the-art radio buttons for dashboard color theme selection and modern toggle buttons to control the visibility of specific dashboard elements.
If you want to build this dashboard yourself, we recommend to upgrade your Excel Version to the latest one which is included in the Microsoft Office 365 Subscription. Find the link for current offers in the Microsoft Store below ↓
▬▬▬▬▬▬▬▬▬▬
You want to become a master in Excel and learn all modern and relevant Excel techniques?
Then definitely have a look at the following links.
💎 RECOMMENDED ONLINE EXCEL COURSES
📌 EXCEL VERSION IN THIS VIDEO
We use the latest version of Excel via the Microsoft Office 365 subscription. This allows us to have all the latest features like new chart types, a huge integrated icon library, improved functions, and much more!
If you want to upgrade your version as well, we recommend to get it from the
▬▬▬▬▬▬▬▬▬▬
You want to show your support and help me grow?
Here is what you can do.
☕ WANT TO MAKE MY DAY?
🔥 MORE AWESOME EXCEL AND POWERPOINT CONTENT
Note: Some of the links in this description are affiliate links, meaning, at no additional cost to you, we will earn a commission if you click through and make a purchase. This supports the channel and allows us to continue to produce videos like this. Thank you for your support!
#interactive #excel #dashboard
 0:04:56
Building a BEAUTIFUL Dashboard Was Never Easier
 0:09:51
12 Dashboard design tips for better data visualization
 0:14:45
How to Create Beautiful Dashboard Background and Tile Design | Ultimate Excel Dashboard Ep. 2
 0:11:09
4 Hidden Excel Dashboard Design Tips for Beautiful Reports
 0:06:09
4 x AI Dashboard Designs in 60 SECONDS!
 0:19:21
📊 How to Build Excel Interactive Dashboards
 0:38:47
Creating a Beautiful Home Assistant Mobile Dashboard Easily!
 0:11:43
How to Create Dashboard in Excel ☑️
 0:10:57
How to Create a Beautiful Python Visualization Dashboard With Panel/Hvplot
 0:18:56
How to create a Simple Dashboard Report in Microsoft Excel
 0:28:08
How to make an Excel Dashboard in 5 Easy Steps (Interactive + Free File)
 0:20:19
How to Build a STUNNING Sales Dashboard in Power BI - Tutorial #2022
 0:00:35
Create Dashboard Pages in Minutes - Soft UI Dashboard Builder | Low Code Dashboard Builder
 0:10:39
Make Your Reports Pop with Custom Excel Dashboard Backgrounds
 0:19:41
Make an Interactive Excel Dashboard in 4 Simple Steps!
 0:05:36
How to Create a Dashboard in Google Sheets in 5 Minutes - 2024 Edition 📈
 0:01:04
I Create Dashboard in One Minute using Python | Python for beginners | #python #coding #programming
 0:30:37
How to build Dynamic & Interactive Dashboard in EXCEL with Pivot Tables&Charts | Tutorial Ep...
 0:20:12
Ultimate Step by Step Google Looker Studio Dashboard Project | End to End Dashboard Project Tutorial
 0:12:55
How to create Power BI Dashboard (Report) in 7 Minutes | @PavanLalwani
 0:41:23
Interactive Dashboard Step by Step + FREE File Download
 0:54:08
How to Create Impressive Interactive Excel Dashboard | Ultimate Excel Dashboard Ep. 1
 0:37:26
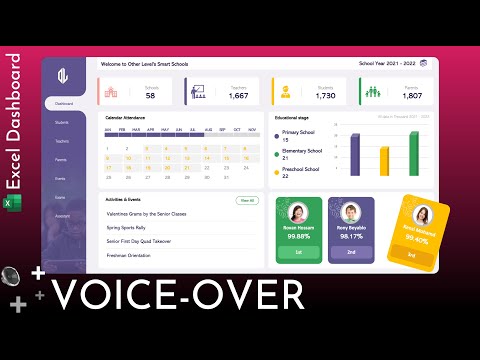
Excel Dashboard for Schools with changing students images dynamically | Full Tutorial + Voiceover
 0:40:32
Create interactive excel dashboard in 5 simple steps #exceldashboard #exceltutorial #pivottable
Комментарии