filmov
tv
Using a log scale for an axis using the ggplot2 R packge (CC110)

Показать описание
Scaling an axis with the log scale is straightforward to achieve in R with the scale_x_log10 (or scale_y_log10) and coord_trans functions from ggplot2. In this episode of Code Club, Pat will discuss these two sets of functions and when to use each to help accentuate the differences between gropus that have low abundances. He'll also add a line to indicate the limit of detection using geom_vline/geom_hline.
Do you have a figure that you would like to receive a critique or help improving? Let me know and I'd be happy to arrange a guest appearance!
You can also find complete tutorials for learning R with the tidyverse using...
0:00 Introduction
4:03 Log scale
6:24 Fixing zeroes
10:42 scale_x_log10 vs coord_trans
15:46 Fixing threshold for which genera to show
17:03 Indicating the limit of detection
19:23 Fixing appearance of axis labels
20:48 Contrasting linear and log scales
 0:01:59
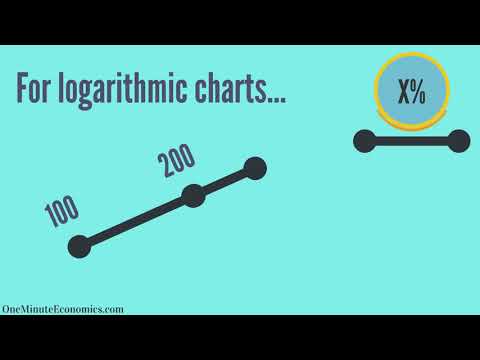
Linear (Arithmetic) and Logarithmic (Exponential Growth) Scales/Charting Explained in One Minute
 0:11:15
Logarithmic scale | Logarithms | Algebra II | Khan Academy
 0:07:26
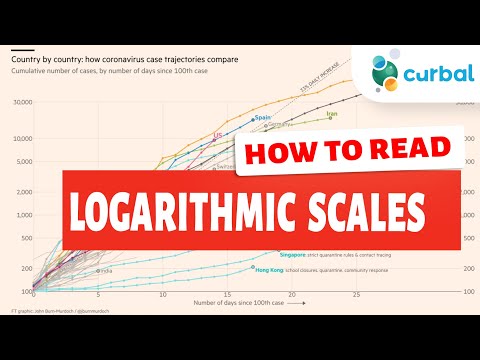
How to Read a Log Scale Graph Made Simple
 0:08:49
Log vs. Arithmetic Scale on Charts - which one to use and when
 0:08:33
How to read a log scale.
 0:02:58
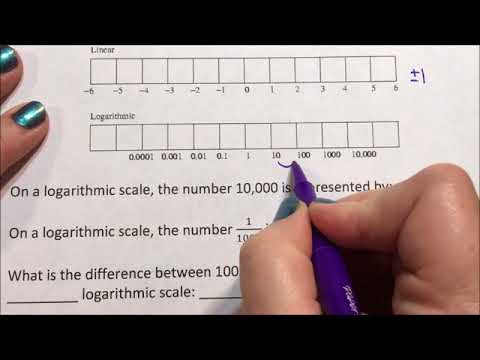
How to Read a Logarithmic Axis
 0:06:35
How Do Log Graphs and Logarithms Work? Logs, Exponents, and Roots Explained.
 0:12:57
What's a Log Scale?? Pandemic Plots Explained!
 0:01:04
How Does pH Change When Diluted? 🤯 No Calculator Needed
 0:07:40
Logarithmic (Log) or Linear Charting - Technical Analysis - What is the Difference? TradingView!
 0:06:04
When you should use Logarithmic scales in your visuals
 0:02:28
Why you should use logarithmic scale when visualizing ratios
 0:03:49
When To Use Logarithmic Scale
 0:02:34
Logarithmic Scale versus Linear Scale
 0:07:09
Logarithmic and Semi-Logarithmic Scale - (Geography)
 0:00:58
Logarithmic Scales Vs. Linear Scales EXPLAINED For Traders!📊 #shorts
 0:02:01
Why Use a Log Log Graph?
 0:05:33
How to scale logs
 0:07:01
LOG VS LINEAR CHARTS
 0:01:27
Why do we use a logarithmic scale when working with sound?
 0:00:56
When and how to use Log
 0:03:34
Logarithms, Explained - Steve Kelly
 0:11:14
Why L? -- the log scale explained
 0:06:18
A Level biology using LOGARITHMS - How to calculate log and when to use it. Math Skills in Biology
Комментарии