filmov
tv
Central Limit Theorem Explained With Simple Python Code and Graphs

Показать описание
#python #data #datascience
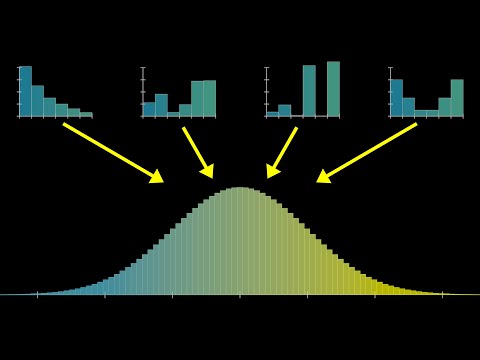
The Central Limit Theorem (CLT) is a fundamental concept in statistics and probability theory that explains why many real-world distributions tend to resemble a normal (bell curve) distribution, even when the data itself does not come from a normal distribution. According to the CLT, when we take a large number of independent, random samples from any population and calculate their means, the distribution of these sample means will approach a normal distribution as the sample size grows.
In this video, I explain the Central Limit Theorem using simple Python code and visual graphs to help illustrate how it works. By understanding the CLT, we gain powerful insights into data sampling, inferential statistics, and real-world applications in data science. You'll see:
How random samples create a normal distribution of sample means,
Why the CLT is essential for making accurate predictions,
And a step-by-step Python code walkthrough with easy-to-follow visuals.
Whether you're new to statistics or looking to deepen your understanding, this video will simplify the Central Limit Theorem and its importance in data science!
 0:07:35
 0:03:42
 0:31:15
 0:07:27
 0:06:39
 0:09:19
 0:09:29
 0:06:42
 0:36:17
 1:01:09
 0:13:14
 0:04:44
 0:03:39
 0:04:25
 0:07:07
 0:09:10
 0:32:11
 0:05:40
 0:00:15
 0:06:53
 0:13:56
 0:06:05
 0:06:31
 0:06:01