filmov
tv
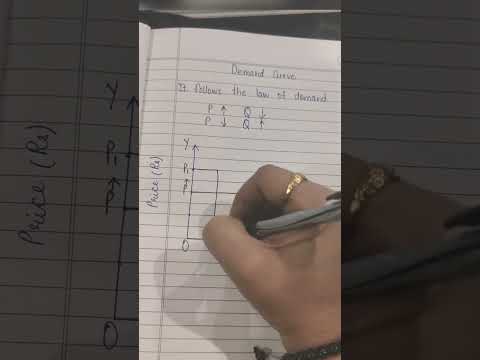
Demand Curve Explained | 12th Economics

Показать описание
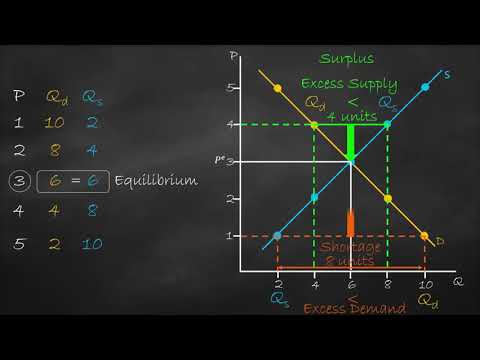
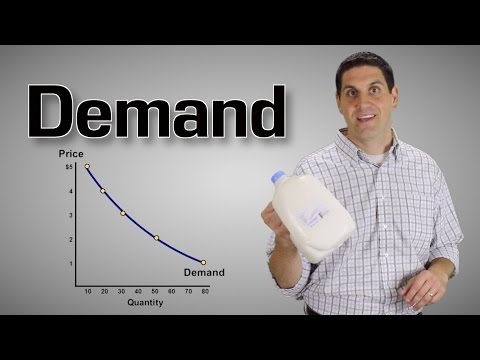
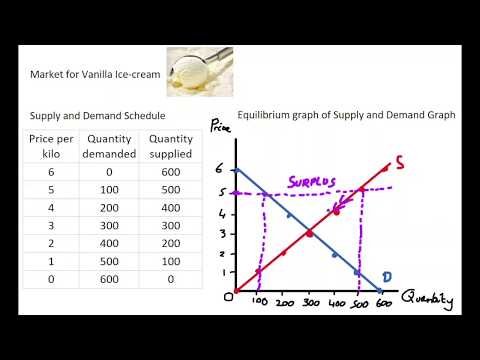
Curious about what a demand curve represents? This quick guide breaks it down for you! A demand curve is a graphical representation showing the relationship between price and quantity demanded. It's a fundamental concept in economics, especially in the chapter on Demand Analysis for 12th-grade students. Whether you're studying for exams or just interested in economics, this short video will help you understand the basics of demand curves. Question: What is represented by a demand curve? Options: 1. The relationship between price and quantity supplied. 2. The relationship between price and quantity demanded. 3. The relationship between income and quantity demanded. 4. The relationship between income and quantity supplied. Correct Answer: 2. The relationship between price and quantity demanded. Explanation: A demand curve shows how many of a product consumers want to buy at different prices. It slopes downward, meaning that as price increases, the quantity demanded decreases.
Standard:
Standard:
 0:07:51
 0:03:31
 0:09:54
 0:04:44
 0:06:11
 0:06:49
 0:03:11
 0:07:47
 0:04:24
 0:04:08
 0:06:43
 0:06:11
 0:04:50
 0:00:16
 0:08:36
 0:10:22
 0:00:54
 0:00:41
 0:00:13
 0:03:45
 0:03:41
 0:08:53
 0:10:17
 0:08:16