filmov
tv
Graphing Secant Function with a a New Amplitude

Показать описание
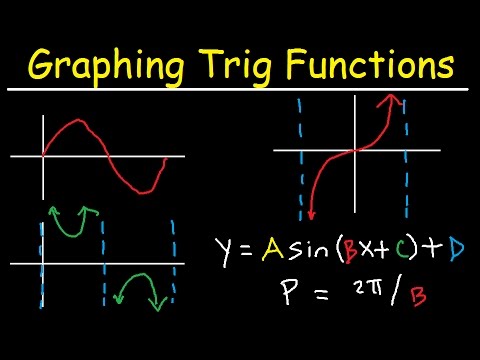
👉 Learn how to graph a secant function. To graph a secant function, we start with the cosine graph by first determining the amplitude (the maximum point on the graph), the period (the distance/time for a complete oscillation), the phase shift (the horizontal shift from the parent function), the vertical shift (the vertical shift from the parent function) and the x-scale (the distance between the turns and the x-intercepts). After we have obtained these features, we plot the points on the graph and graph accordingly. The x-intercepts of the cosine graph become the asymptotes of the secant function and the graph of the secant function goes in the opposite direction to the graph of the cosine function using the same turns.
Organized Videos:
✅ How to Graph Trigonometric Functions
✅ How to Graph Tangent | Learn About
✅ How to Graph Secant | Learn About
✅ How to Graph Sine and Cosine | Learn About
✅ How to Graph Trigonometric Functions | Learn About
✅ How to Graph The Sine Function
✅ How to Graph The Cosine Function
✅ How to Graph The Tangent Function
✅ How to Graph The Cotangent Function
✅ How to Graph Cosecant Function
✅ How to Graph The Secant Function
Connect with me:
#trig #graphing #brianmclogan
 0:08:18
How to Graph Secant and Cosecant
 0:09:04
Graph the secant function with a phase shift
 0:03:02
Graphing the Secant Function Example
 0:19:13
Graph Secant and Cosecant Using a Table and Transformations
 0:05:30
Graphing Secant Function
 0:05:55
Ex: Find the Equation of a Transformed Secant Function From The Graph
 0:04:50
How to graph the secant graph
 0:09:22
Graph Secant Function
 1:07:58
Graphing Trigonometric Functions, Phase Shift, Period, Transformations, Tangent, Cosecant, Cosine
 0:12:33
Learn How to Graph the Secant Function with a Change in Period
 0:09:10
Graphing a Secant Function, EX 1
 0:04:02
Graphing the secant function using Desmos (degrees)
 0:03:44
Example: Graphing the Secant Function Using the Cosine Function
 0:05:20
Graphing the Secant Function with a Reflection and Change in Period
 0:06:30
The Basic Secant Function Graph
 0:09:46
Graphing the Secant Function with a Horizontal Shift
 0:13:57
graphing sec and csc
 0:11:07
GRAPHING SECANT AND COSECANT FUNCTIONS
 0:09:15
Graphing the Secant Function with a Vertical Shift
 0:08:04
Graphing the Secant Graph with Multiple Transformations
 0:00:06
The secant function: Domain, range, time period, graph, and type of function.
 0:30:40
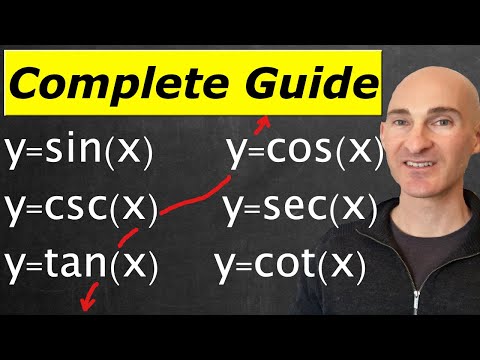
Graphing Sine, Cosine, Cosecant, Secant, Tangent & Cotangent (Complete Guide)
 0:13:50
Graphing a Secant Function pg 47, pt 1
 0:07:26
Graphing Secant Functions
Комментарии