filmov
tv
Bell Curve

Показать описание
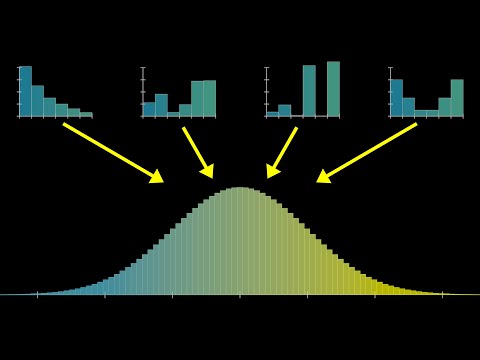
This bell curve video is a representation of what happens most of the time. We use this type of model in cases where mean, median and mode are all the same. When we drop hundreds of balls from the same spot one at a time they don’t all fall in precisely the same place, they have some normal variation. This bell curve exhibit shows us where the most common landing spot is, how wide a variation we have in landing spots and what percentage lands in the most common vs the least common, that is called the standard deviation.
We hear about standard deviation all the time these days, it seems like we are measuring EVERYTHING.
Thats because we are. Because we can learn so much from collecting data.
“Most”
“Everyone”
“All of the…”
We hear and observe statistics daily, in the news, in school.
Do people follow the speed limit?
How do people do on the SAT’s?
What is a typical shoe size?
These can be measured using the central limit theorem.
UGH but what does THAT MEAN?
All can be illustrated using a bell curve like the one we see here in the Mathematica exhibit at The Henry Ford museum in Dearborn, MI.
What is your favorite thing to measure and assess probability of?
#thehenryford #inspiredbythf #homeschoolmath #homeschool #homeschooling #homeschoolmom #math #homeschoollife #homeschoolmama #homeschoolscience #homeschoolfun #mathematics #homeeducation #homeschoolingmom #homeschoolteacher #homeschoolrocks #learningathome #homeschoolpreschool #homeschoolers #homeschooler #homeschoolife #zoom #onlinemath #onlinescience #algebra #henryfordmuseum
 0:01:04
 0:40:55
 0:03:48
 0:00:45
 0:05:13
 0:07:37
 0:02:52
 0:00:30
 0:27:57
 0:05:37
 0:01:25
 0:06:55
 0:10:33
 1:11:39
 0:05:35
 0:31:15
 0:11:05
 0:08:50
 0:24:46
 0:12:10
 2:44:16
 0:01:01
 0:04:16
 0:07:00