filmov
tv
Java - How To Create a PIE and DONUT Chart In Java Using Graphics In NetBeans [With Source Code]

Показать описание
Java Swing Pie Chart Tutorial
[[[[[[[[[[[[[[[[[[[[[[[[[[[[[[[[[[[[[[[[ Check out my Java Projects! ]]]]]]]]]]]]]]]]]]]]]]]]]]]]]]]]]]]]]]]]
[[[[[[[[[[[[[[[[[[[[[[[[[[[[[[[[[[[[[[[[ JAVA Products ]]]]]]]]]]]]]]]]]]]]]]]]]]]]]]]]]]]]]]]]
[[[[[[[[[[[[[[[[[[[[[[[[[[[[[[[[[[[[[[[[ Project Description ]]]]]]]]]]]]]]]]]]]]]]]]]]]]]]]]]]]]]]]]
In this Java Tutorial we will see How To Create a Pie Chart and Donut Chart using graphics class in java netbeans.
The PieChart class extends JFrame and initializes a window displaying a pie chart with three slices of different colors.
Legends or labels are drawn next to the pie chart, displaying the slice number and its percentage.
Legends are represented as colored boxes with corresponding text.
What We Will Use In This Java Tutorial? :
- Java Programming Language.
- NetBeans Editor.
Java Swing Components We Will Use In This Java Tutorial:
- JFrame.
- JPanel.
- Graphics.
- Graphics2D.
[[[[[[[[[[[[[[[[[[[[[[[[[[[[[[[[[[[[[[[[ TABLE OF CONTENT ]]]]]]]]]]]]]]]]]]]]]]]]]]]]]]]]]]]]]]]]
▶ 00:00 The Final Result Overview
▶ 00:30 Create The PIE Chart
▶ 26:00 Create The Donut Chart
[[[[[[[[[[[[[[[[[[[[[[[[[[[[[[[[[[[[[[[[ JAVA Tutorials ]]]]]]]]]]]]]]]]]]]]]]]]]]]]]]]]]]]]]]]]
[[[[[[[[[[[[[[[[[[[[[[[[[[[[[[[[[[[[[[[[ JAVA COURSE ]]]]]]]]]]]]]]]]]]]]]]]]]]]]]]]]]]]]]]]]
--------------------------------------------------------------------
if you want to support our work, consider supporting the channel with a coffee!
programming projects with source code:
C# And Java Programming Books
 0:02:31
Java Tutorial: How to Create a Java Project in Eclipse
 0:14:00
Learn Java in 14 Minutes (seriously)
 0:09:51
Create Your First Java Program from Scratch in Minutes
 2:30:48
Java Full Course for Beginners
 0:06:07
Creating a Class in Java
 0:08:41
Making a Game with Java with No Experience
 0:11:36
Java Classes & Objects
 0:12:58
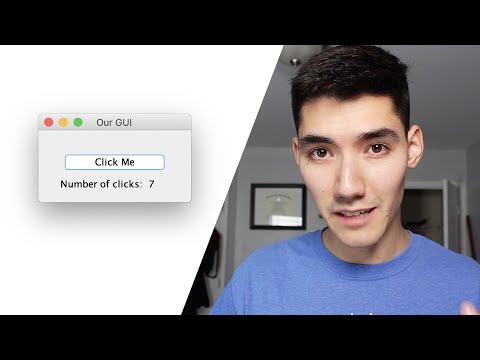
Java GUI Tutorial - Make a GUI in 13 Minutes #99
 0:13:05
Encapsulation in Java | Vishwa Mohan | Day -13
 0:07:38
Java Constructors - Full Tutorial
 0:13:38
Creating your first Java application with IntelliJ IDEA
 0:01:00
Java Program to Create Login Page
 0:07:21
Java Programming Tutorial 17 - Creating Basic Classes, Methods, and Properties
 0:07:19
Creating a Class in Java - Practice
 0:09:40
Create Your First Java Project using Visual Studio Code 2021 and Java JDK 17
 0:02:22
Java for the Haters in 100 Seconds
 0:04:24
How to set up Java in Visual Studio Code
 0:05:44
7.2 Creating Object in Java
 0:01:00
Objects and Classes in Java
 0:02:21
Eclipse - Create Java Project
 0:02:25
Java in 100 Seconds
 0:00:45
Why people HATE JAVA 😡☕️ #coding #programming
 0:07:00
Abstract Classes and Methods in Java Explained in 7 Minutes
 0:14:54
Learn Java in One Video - 15-minute Crash Course
Комментарии