filmov
tv
How to Create Charts and Graphs in Microsoft Excel - Quick and Simple

Показать описание
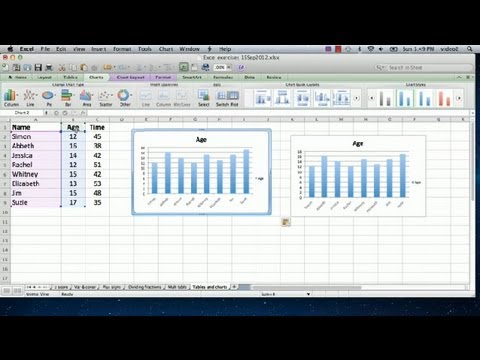
In this video tutorial for beginners, I will show you how to make charts and graphs in Microsoft Excel. Using data, I will show you how you can quickly and simply create a chart and customize it the way you would like.
0:00 Introduction
1:00 Quick ways to create a chart in Excel
3:23 Selecting your data series to graph
4:01 Selecting multiple data series to graph
4:32 Adding your first data series to a chart
5:15 Selecting your chart elements
5:35 Labeling your axis titles
5:55 Adding a legend to your graph
10:12 Adding more data to your chart
12:51 Formatting data series
15:34 Deleting a data series from a chart
16:27 Change chart type
17:42 Add images to your chart
18:59 Change your chart area
20:12 Save your chart as a picture
 0:24:31
Excel Charts and Graphs Tutorial
 0:21:14
How to Create Charts and Graphs in Microsoft Excel - Quick and Simple
 0:09:19
Excel Quick and Simple Charts Tutorial
 0:14:10
Excel Charts & Graphs: Learn the Basics for a Quick Start
 0:13:25
How to Create Graphs and Charts in Canva | New feature
 0:00:26
How To Create Better PowerPoint Charts in 10 Seconds
 0:03:09
The Easy Way to Create Graphs & Charts | Tip Talk 13
 0:05:42
Creating Charts
 0:03:26
How to Create a Gantt Chart in Trello | 5-Minute Guide
 0:19:07
Make Beautiful Excel Charts Like The Economist (file included)
 0:05:44
How to make Charts and Graphs in ChatGPT - Data visualization | Zubair Jammu
 0:08:58
034. A better way to create Charts for SURVEY RESULTS in EXCEL
 0:18:54
How to make Charts and Graphs in Illustrator (with Datylon plugin)
 0:04:31
Excel: Charts
 0:03:41
How to Create Charts in Excel 2016
 0:05:39
How to Create Charts in Excel for Data Analysis
 0:14:48
Introduction to Pivot Tables, Charts, and Dashboards in Excel (Part 1)
 0:10:37
How to Create and Customize Charts in Microsoft Word
 0:09:20
Microsoft Excel 2016 - Create and Manage your Charts and Graphs [COMPLETE]
 0:12:37
Advanced Excel: Using Charts and Functions to See Trends
 0:19:49
How to Create EASY Infographics with the (improved!) Charts and Graphs Canva feature
 0:06:12
How to Make Tables & Charts in Excel : Using Microsoft Excel
 0:04:29
How to quickly make multiple charts in excel
 0:12:03
Create CHARTS in Apple Numbers
Комментарии