filmov
tv
9. Median | Continuous Series | Statistics | Niraj Pandey

Показать описание
In statistics, the median is a measure of central tendency that represents the middle value of a dataset when it is ordered from least to greatest. It divides the dataset into two equal halves: one half contains values greater than or equal to the median, and the other half contains values less than or equal to the median.
To find the median:
Arrange the data in ascending order: If the dataset has an odd number of values, the median is simply the middle value. If the dataset has an even number of values, the median is the average of the two middle values.
Identify the middle value or values: If there's an odd number of values, there will be a single middle value. If there's an even number of values, there will be two middle values.
Calculate the median: For an odd number of values, the median is the middle value. For an even number of values, the median is the average of the two middle values.
The median is often used instead of the mean (average) when the data is skewed or contains outliers, as it is less sensitive to extreme values. It provides a better representation of the "typical" value in the dataset in such cases.
Join and get free PDFs!
Method 01:
Just click on the given Telegram link and join!
or
Method 02:
Go to your browser (Google Chrome or something) and manually type the URL given below, and join!
Sampling Techniques:
For more queries,
Contact us on WhatsApp: 7317240017
Subscribe to STUDY COMMERCE
#Median #Statistics #STUDYCOMMERCE

Statistics | Part 9 | Median | Continuous Series.
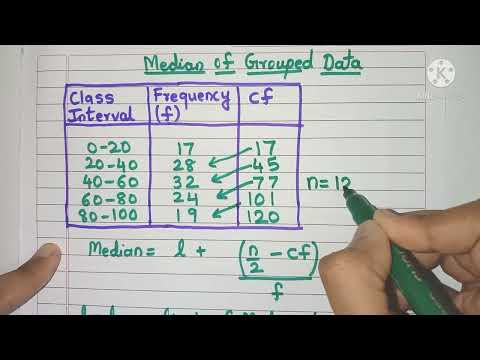
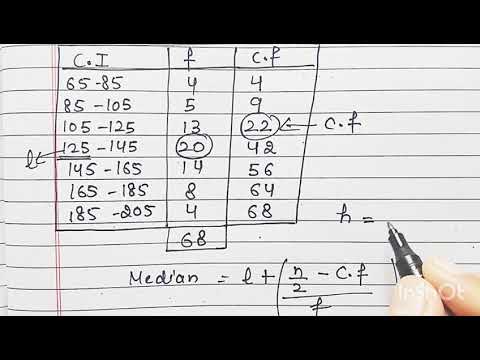
How to calculate Median for Grouped Data? | Formula for Median of Grouped Data

MEDIAN Continuous Series | Sanat Sir | Ecoholics

Median - Continuous Series | Statistics | Measures of Central Tendency | How to Calculate Median

Class 11 Statistics Ch 9 | Median & Mode | 4 - Median Continuous Series

Mean median mode range

Statistics-Median for continuous Series calculation of Median

14. 'Median Calculation in Continuous Series' from Statsitics Subject

Calculating Median when more than type data is given ||Class10th ||Statistics

Mean, Median & Mode for Continuous Series || mean median mode in English || grouped data || Arya

Find The Median | Statistics | If the median of following data is 24 , Find the value of y .|4 Marks

How to find out Median in Continuous series (part 1 )

HOW TO CALCULATE MEDIAN FOR GROUPED DATA? || FORMULA FOR MEDIAN OF GROUPED DATA

how to calculate median, quartiles in continuous series.
How to find Median

formula of median continuous series

Mean, Median, and Mode of Grouped Data & Frequency Distribution Tables Statistics

Median for Discrete & Continuous series ...Central Tendency Lec-9 (CA Foundation)

Mean,Median,Mod And Range👍🏻 #MATHSFUN#shorts #viral
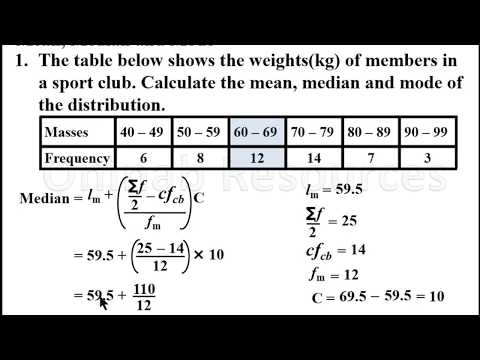
Mean, median and mode of grouped Data(Lesson 1)

9. Median | Continuous Series | Statistics | Niraj Pandey

Calculation of MEDIAN in Continuous Series l Median l Continuous Series l Statistics

Median in case of continuous series
