filmov
tv
Describing Scatterplots: Strength, Form, Direction, & Outliers

Показать описание
Scatterplots are a graphically representation of the relationship between two quantitative variables. We describe scatterplots by talking about the direction, strength, form, and outliers. The acronym DOFS might help.
We also identify the explanatory and response variable. We then add a point to the graph and describe in context what is unusual about the point.
 0:01:54
Describing Scatterplots: Strength, Form, Direction, & Outliers
 0:06:35
1 Describing scatterplots form, direction, strength, outliers article Khan Academy
 0:03:58
Scatterplot (form, direction, and strength)
 0:07:28
Strength and Direction in a Scatterplot
 0:11:01
Describing Scatterplots
 0:14:56
Maths Tutorial: Interpreting Scatterplots (statistics)
 0:06:47
Describing Scatterplots with CDOFS
 0:05:42
Interpreting Scatterplots: Association, Strength & Outliers
 0:28:40
Scatterplots: Direction, Strength, Form
 0:04:51
Scatter Plots, Association and Correlation
 0:07:51
SCATTER PLOTS (form) (direction), and (strength) - M11/12SP-IVg-4
 0:22:20
Describing relationships in scatter plots - form strength direction
 0:10:28
7C - Describing association Direction+Form+Strength
 0:11:07
How to describe the strength & direction of bivariate data correlation from a scatterplot (examp...
 0:08:11
Describing the Shape (Form), Trend (Direction), and Variation (Strength) Based on a Scatter Plot
 0:05:36
Interpreting Scatterplots - Strength
 0:02:47
Scatterplots Including Explanatory and Response Variables, and Direction, Form and Strength
 0:07:04
Describing Scatter Plot Associations
 0:00:34
Scatterplots on SAT Math 🔑 #11
 0:05:29
Describe a relationship in terms of strength and direction
 0:04:23
Interpret a scatter plot by identifying clusters and outliers
 0:08:12
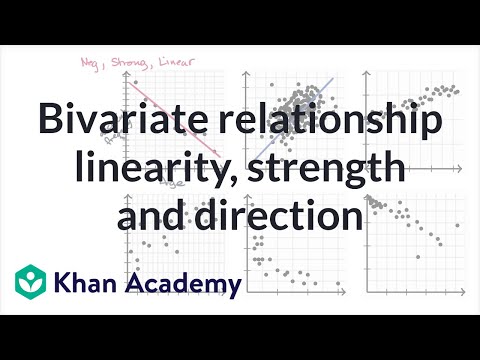
Bivariate relationship linearity, strength and direction | AP Statistics | Khan Academy
 0:22:48
DESCRIBING THE SHAPE (FORM), TREND (DIRECTION) AND VARIATION (STRENGTH) BASED ON SCATTER PLOT
 0:00:39
What is the XY Scatter Plot | #Statistics #LeanSixSigma #OpEx #SixSigma #ASQGreenBelt #CSSGB
Комментарии