filmov
tv
Use Excel 2016 to plot weather data

Показать описание
This screencast demonstrates how to plot data that was downloaded from the ME 120 web site as a CSV file

Plot Multiple Lines in Excel

Microsoft Excel 2016 - Create and Manage your Charts and Graphs [COMPLETE]

How To Make A Line Graph In Excel-EASY Tutorial

How to Graph a Function in Excel 2016

How to Make a Line Graph in Excel

Creating a Scatter Plot in Excel 2016

How to Make a Graph in Excel

How to Create Charts in Excel 2016

Excel Functions, Data Validation and Forecasting: Master Data Analysis Using Excel Live
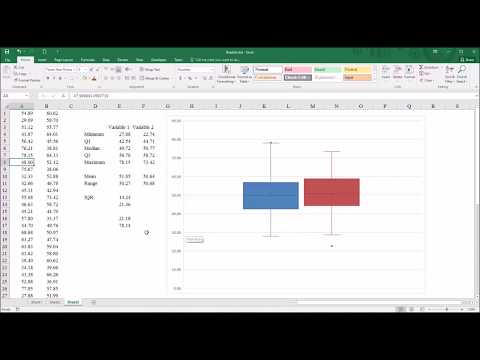
Creating a Boxplot in Excel 2016

Boxplot in Excel 2016 erstellen und richtig interpretieren - Daten visualisieren in Excel (26)

How to Make a Graph in Microsoft Excel

Use Excel 2016 to make Frequency distribution and Histogram for quantitative data

📊 How to create and design a Clustered Column Chart in Excel using Quick Styles

Excel Quick and Simple Charts Tutorial

Excel Charts & Graphs: Learn the Basics for a Quick Start
Microsoft Excel 2016 - Full Tutorial for Beginners [COMPLETE in 13 MINUTES!]*

How to Create a Box Plot Chart in Excel 2016
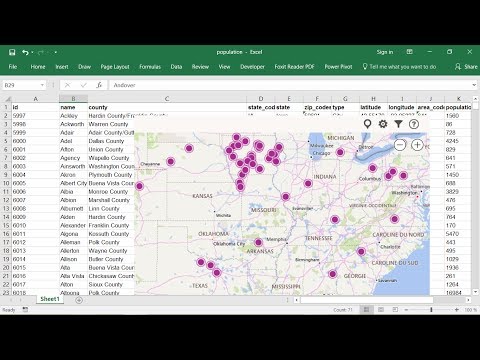
Excel 2016 visualize data on Bing maps

Make a Combination Column and Line Chart in Excel 2016 or later

How to Add a Trendline to a Graph in Excel

Gantt Chart Excel Tutorial - How to make a Basic Gantt Chart in Microsoft Excel 2016

Use Excel 2016 to make Bar Graph for categorical data
