filmov
tv
What Are Candlestick Patterns? | Candlestick Patterns Based Automated Trading | Quantra Course

Показать описание
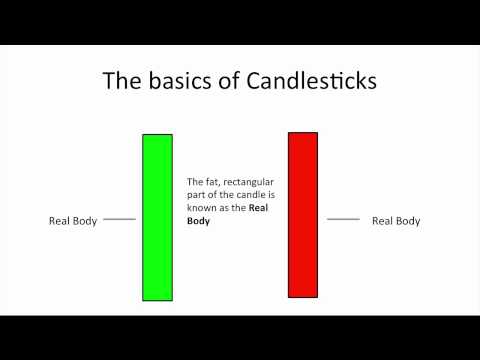
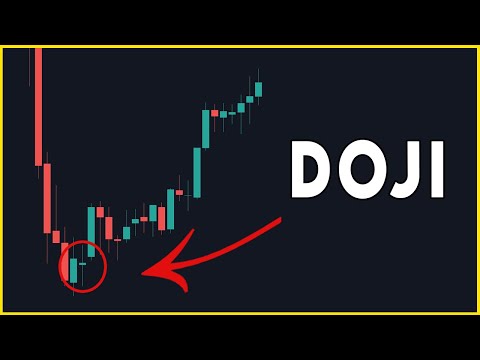
Welcome to this video on candlestick patterns. By the end of this video, you will be able to describe candlestick patterns and the advantages of using them. Look at the chart on the screen. The prices were in a clear uptrend. Then the green candle with a long wick and small body appeared. Immediately after that, the market started falling. Take note, the longer wick is above the body. The specific shape and location of the green candle in an uptrend gave an indication of where the prices might go. Now, look at this chart snippet. The candlestick is very similar to the previous one you saw, it is green and appears during a downtrend. But, the longer wick is below the body. Immediately after this, the markets starts to rise. This is exactly what candlestick patterns are. They are candles with special shapes, like a small body and long wick, that can be an indicator of bullishness, bearishness or neutrality. In the first example, the candlestick was bearish. And in the second example, the candlestick was bullish. This is a green candle with no wicks. It indicates bullishness in the market. And is called a Marubozu. On the other hand, the candle with a very small body and large wicks indicates indecision in the market. It is called a Doji. There are many other patterns like Shooting Star and Hammer that indicate a different market sentiment. We will soon be covering all of these patterns in-depth. But before actually jumping to use them, have you wondered why they are a good trading tool? Well, one of the assumptions of technical analysis is that history repeats itself. If you can find patterns that seem to repeat time and again and give you the very same results, you can surely rely on them because they give you an intuition of where the market might move next. In the chart, you will see two instances of a candle with a long wick and a small body. Within approximately 4 hours, the candle appeared twice. And each time the candle appeared, the market showed a small downward trend. This is why candlestick patterns are a popularly used tool when it comes to trading. Throughout the course, we will walk you through the various types of candlestick patterns such as the Marubozu, Doji, shooting star, and hammer and also explain the rationale behind their formation. This will surely help you implement the popular candlestick patterns while you build your own trading strategies. In the very next section, you will be introduced to a candlestick pattern called the Bullish Marubozu. See you then!
Quantra is an online education portal that specializes in Algorithmic and Quantitative trading. Quantra offers various bite-sized, self-paced and interactive courses that are perfect for busy professionals, seeking implementable knowledge in this domain.
 0:11:45
 0:13:30
 0:18:00
 0:00:44
 0:38:24
 0:05:42
 0:43:04
 0:55:18
 0:00:04
 0:32:50
 0:53:16
 0:01:00
 0:00:47
 0:22:59
 0:54:56
 0:01:00
 0:13:55
 0:00:07
 0:09:42
 0:43:20
 0:00:59
 0:00:05
 0:00:06
 0:00:52