filmov
tv
Figure shows a 2.0 V potentiometer used for the determination of internal resistance of a 1.5 V...

Показать описание
Figure shows a 2.0 V potentiometer used for the determination of internal resistance of a 1.5 V cell. The balance point of the cell in open circuit is 76.3 cm. When a resistor of 9.5 Ω is used in the external circuit of the cell, the balance point shifts to 64.8 cm length of the potentiometer wire. Determine the internal resistance of the cell.
📌 PHYSICS WALLAH OTHER CHANNELS :
📌 PHYSICS WALLAH SOCIAL MEDIA PROFILES :
📌 PHYSICS WALLAH OTHER CHANNELS :
📌 PHYSICS WALLAH SOCIAL MEDIA PROFILES :
 0:08:53
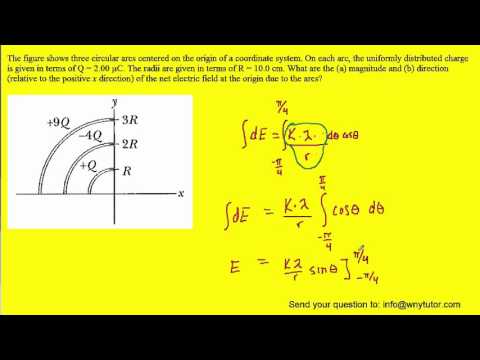
The figure shows three circular arcs centered at the origin of a coordinate system
 0:11:10
The figure shows a thin plastic rod of length l
 0:02:47
figure shows two plane mirrors parallel to each other and an object O is placed between them
 0:03:55
Figure shows the variation of electric field intensity \( E \) vers...
 0:09:42
The figure below shows a 12.0 v battery and four uncharged capacitors of capacitances
 0:06:27
1.16 Fig shows the current through and thevoltage across an element. Sketch and find total energy.
 0:14:38
The figure shows a nonconducting rod of length l
 0:05:16
The figure shows a red car and a green car
 0:02:17
TRIGONOMETRY in Swedish National Exams (NpMa4 ht 2013, Question 5) #shorts
 0:12:35
The figure shows position-time graph of two Riders C and D. Based on the...| Krishna Ke Doubts
 0:01:45
Figure shows two ships moving in x y-plane with velocities v_A and v_B. The ships move such that ...
 0:05:38
Figure shows the graph of the x-coordinaste of a particle going along the X-axis as a function o...
 0:04:32
Figure shows two identical capacitors, \( C_{1} \) and \( \mathrm{C}_{2} \) each of \( 1 \mu \ma...
 0:02:56
Figure shows two small identical magnetic dipoles \( a \) and \( b ...
 0:05:47
The figure shows two blocks connected by a cord
 0:19:37
figure shows two blocks connected by a light string placed on the two inclined parts of a triang...
 0:01:30
HCV: Figure shows x-t graph of a particle. Find the time t such that the average velocity of the
 0:08:20
Figure shows an imaginary cube of edge L/2. A uniformly charged rod of length L moves toward left
 0:03:17
HCV: Figure shows the graph of velocity versus time for a particle going along the X-axis. Find
 0:09:31
Figure shows a cube of edge lenth a
 0:01:53
Figure shows the orientation of two vectors `u` and `v`in the `XY` plane. if`vec
 0:04:56
Figure shows a set of equipotential surfaces. The magnitude and direction of electric
 0:06:31
Figure shows two processes \( a \) and \( b \) for a given sample o...
 0:02:17
Figure shows the velocity time graph of a particle moving along straight line `(v` is m/s and `t`
Комментарии