filmov
tv
How To Calculate Standard Deviation Using Python and Pandas
Показать описание
This tutorial explains how to use the Python Pandas library to calculate the Standard Deviation of a dataset.
We will compare the mean, standard deviation, and coefficient of variation for three datasets using Pandas. We will also compare the difference in calculating the standard deviation with Pandas and NumPy.
We will also use Matplotlib to plot the points in a dataset to see where they are located based on mean and standard deviation values.
---------- CHAPTERS ----------
(00:00:15) Explanation of the concept of standard deviation.
(00:00:45) Create a Pandas dataframe that contains historical data we will analyze (the data is in CSV format).
(00:01:30) Use Jupyter Notebook to create the dataframe from the data (import the pandas library).
(00:03:00) Calculate the mean with Pandas.
(00:03:27) Refactor our code to create a function that returns a Pandas dataframe from a CSV file.
(00:05:20) Refactor our Python code to make it more flexible.
(00:06:50) Improve the program to calculate the standard deviation of the close price for three different stocks.
(00:08:19) Introduce the concept of Coefficient of Variation.
(00:09:38) Calculate the standard deviation using the Python NumPy module.
(00:11:15) Plot our dataset using Matplotlib.
Go through the full tutorial on the CodeFatherTech blog:
Download the full source code of this tutorial and the CSV files here:
 0:07:14
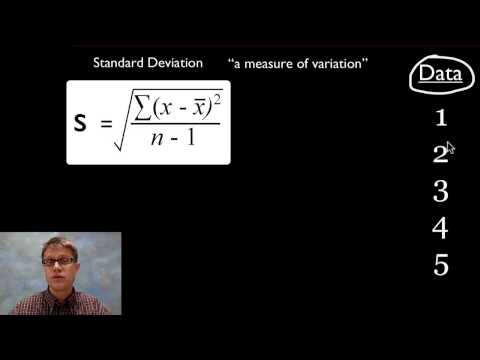
How To Calculate The Standard Deviation
 0:05:05
How to calculate Standard Deviation and Variance
 0:03:09
Standard Deviation How to Calculate by Hand (Formula)
 0:00:59
Calculator Guide - Mean and Standard Deviation
 0:10:21
Standard Deviation Formula, Statistics, Variance, Sample and Population Mean
 0:07:49
Standard deviation (simply explained)
 0:12:42
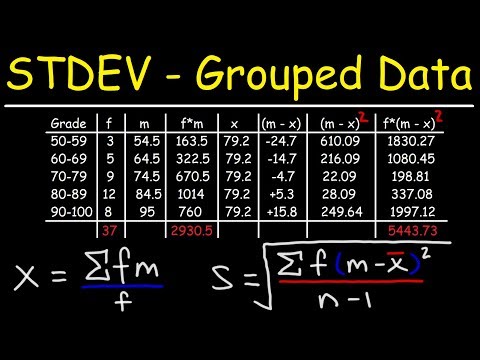
How To Calculate The Standard Deviation of Grouped Data
 0:00:41
Variance and standard deviation in 40 seconds
 0:08:12
Statistics Class 11 | Finding Correct Mean & Standard Deviation | NEB | PYQs + Concept Explaine...
 0:01:00
How to use a calculator to find the standard deviation
 0:12:12
How to find the mean, median, mode, standard deviation and variance.
 0:00:20
How To Calculate Standard Deviation In Excel | Rapid MS. #ytshorts
 0:02:39
Standard Deviation (Ungrouped Data)
 0:05:00
Statistics - How to calculate the standard deviation
 0:07:50
Standard Deviation
 0:02:06
How To Calculate Sample Standard Deviation (Step By Step)
 0:12:05
How To Calculate The Standard Deviation In Excel
 0:00:55
How to calculate Standard Deviation? #shorts #short #shortsvideo #shortvideos
 0:00:15
Standard Deviation (SD) | Excel | Statistics Bio7
 0:02:39
How to calculate Standard deviation, Variance and Mean in Casio 991 ES Plus
 0:03:00
Calculate mean, variance, and standard deviation using Casio calculator
 0:00:35
Calculate Standard Deviations| #rgpv #scientificcalculator #shortsfeed #maths
 0:04:52
Standard deviation for Ungrouped data #StandardDeviation #UngroupedData #Statistics
 0:00:59
Standard Deviation and Variance. #Shorts
Комментарии